 tipster-8b4794
A single bet presents the bettor and the bookmaker with completely different tasks. The bettor is trying to predict the number of corners. The bookmaker is deciding how much it will pay if the bettor turns out to be right. For most bookmakers, that decision is shaped primarily by three factors: competitors’ lines, betting activity and margin.
The kind of match-by-match analysis bettors usually have in mind is not on that list. That does not mean the market operates without analysis altogether; rather, its analysis takes a different form from the bettor’s. Modern bookmaker analysis is largely about turning data into models and incorporating their outputs into the line. Hundreds of operators reproduce the same odds, but those odds originate within a much smaller circle.
The betting market is, in a way, like a classroom ecosystem: a few straight-A students in the front row do the analysis, create metrics, train models on them and calibrate the results before the data make their way to the neighbouring desks. Everyone who gets hold of the data makes their own adjustments: the student so the teacher does not spot the copy, the bookmaker to adapt the line to its own betting activity. Formally, it is a classroom full of straight-A students; in reality, the bookmaker market can be divided into cappers and traders who follow them step by step.
For most bookmakers, the absence of their own original analysis is not a weakness but a normal business model. They do not need to produce the initial estimate themselves to beat the bettor as consistently as the operators that do.
In some months, the bookmaker and its customers may reach something close to parity, and the bookmaker may occasionally even finish a period without a profit. Over the long run, however, those deviations are absorbed by margin and book management, allowing the business to remain profitable even through poor stretches. Direct manual analysis is usually absent altogether, or appears in isolated cases more as a demonstration of expertise on social media than as the foundation of the line.
At the same time, the absence of manual analysis does not make the line wrong. And if a genuine technical error does occur — reversed odds, for example — trying to exploit it is usually pointless: the bet will either be voided or settled at the correct price under the palpable error rule. Systematically hunting for such mistakes will also lead to lower individual limits as part of the bookmaker’s risk management.
But the absence of a technical error does not mean the line describes a specific match exhaustively. The bookmaker works with mass probability estimates and prices; the bettor works with an individual match and a possible departure from the typical scenario.
To understand where such a departure may arise, we first need to examine what a bookmaker’s corner estimate is built on.
How Bookmakers Calculate Corners
The tools used by major bookmakers have changed in recent years, but the underlying logic has not. Before the match, a corner model will usually account for the teams’ average numbers — corners won and conceded — as well as head-to-head results, home advantage and line-ups. Weather, pitch condition and other additional factors are included less frequently.
In-play, the model also incorporates the score difference, the time remaining, territorial control and activity in the final third, shots and blocks.
That is the fullest version of the calculation. In most cases, the first two or three groups of inputs are enough: averaging does not work perfectly, but it works well enough to keep beating the bettor over the long run.
What has changed most is the way these inputs are processed. Pre-match models are now built on event-level data, while live betting odds are automatically recalculated from the data feed every few seconds. The human role has shifted from calculation to supervision: a bookmaker trader monitors a large number of matches at once and intervenes only when a situation requires additional checking or adjustment. Under normal conditions, the odds move without human involvement. Most operators also automate line movement by following several line-originating bookmakers rather than conducting their own analysis of every match.
In such a system, a footballer is not merely a name on the team sheet but a set of digital weights and coefficients that affect the final metrics.
Automation has made lines more accurate, but it has not removed the limitations of an averaged model: broad statistical patterns do not always describe the conditions of a specific match in sufficient detail. This is where the dividing line lies between the pointless search for a technical mistake and analysing the match for yourself.
A bookmaker does not necessarily need to understand where corners come from. A bettor does. The bookmaker earns money because averaging works well enough over the long run. The bettor’s task is to find matches in which average values alone are not enough to produce an accurate estimate.
Knowing how many corners a team normally wins is therefore not enough. You need to understand how it gets them.

Premier League 2025/26 corner averages by club.
The bettor’s practical task is not to collect more figures than the bookmaker, but to notice when the mechanism behind the familiar figures has changed. A team’s average corner count may remain the same even though its first-choice winger is unavailable, its full-back has started playing narrower, or a change of formation has altered the entire structure of the flank. The historical figure remains in the table, but it no longer describes quite the same team that will take the pitch.
The Geometry of Attacks
Let us start with the basics. The centre is the most attractive target for any team because progressing through the central channels leaves more options for continuing the attack. From there, a player can shoot or pass with either foot, continue through the left or right half-space, switch the ball to either flank or carry it forward himself, drawing opponents out and forcing them to leave their zones. The attack retains a choice and remains less predictable, while the defence has to account for several different scenarios at once.
That is why central areas are defended more densely, often with the deliberate aim of steering the opponent towards the touchline. A corner can, of course, arise in many ways: from a goalkeeper’s save, a blocked shot, a defensive clearance over the goal line, a deflection after a cross or an attempt to stop a dribble. But the actions that lead directly to such situations — one-on-one take-ons, crosses and low deliveries — are repeated more often on the flanks.
A move through the centre followed by a shot that the goalkeeper pushes behind is also a perfectly valid route to a corner. However, the connection between the original attacking structure and the final event is less direct: the ball has to pass through a longer chain of actions, with every additional episode introducing new variables. But the chain of actions the ball must pass through before that event occurs is longer. Longer means more complex. That makes such a chain harder to use when analysing a specific match. So that is not where we should be looking.
It is better to begin with mechanisms that are more visible and repeatable: how a team positions its players on the flanks, how wide they operate and how far they advance towards the opposition byline.
How Flank Positioning Relates to Corner Numbers
By a flank pairing, we mean two players who form the lower and upper levels of the attack on the same side of the pitch. Most often, this will be a full-back and a winger, but depending on the formation, the pairing may consist of a wing-back and an interior midfielder, or a wide centre-back and a team-mate positioned further forward. We will examine the differences between formations separately; for now, the key issue is how the two players in the pairing position themselves relative to each other.
A corner often begins several actions before the ball reaches the corner flag. To take the ball to the byline, it is not enough simply to have two players on the flank. What matters is the range of options created by their relative positioning.
When both players operate at roughly the same height, the attack tends to develop more linearly: the ball is played into feet, while a separate channel for a forward pass into space down the flank is less likely to appear. But when one player in the pairing is positioned deeper and the other higher, a diagonal is formed, giving the lower player more ways to continue the attack. First, there is generally a free channel in front of him for an overlapping run. Second, he can play diagonally into the higher team-mate, continue his movement and receive a return pass closer to goal — in other words, play a one-two.
This positioning does not automatically produce a corner. It can, however, make progression towards the byline easier — towards the area where a low cross, a delivery, a take-on or a defensive clearance can end in a corner. For analysis, it is therefore important to examine not only how many corners a team wins, but also how regularly it reproduces a structure that takes its attacks into those areas.
The position of each player in the pairing can be described through width and height. Width shows how close the player operates to the touchline, while height shows how far his area of activity is advanced towards the opposition goal. But these parameters describe the players individually and do not yet capture the geometry between them.
To express their relative positioning numerically, TipsGG used a metric called OverlapAngle — the angle of the line connecting the average action zones of the two players in the pairing.
An average position here means the average point of all the player’s on-ball actions: the coordinates of his events are averaged along the X and Y axes. It is not a tracking-derived average and does not represent the place where the player physically spent most of the match. In Wyscout data, coordinates are normalised according to the direction of attack: a team’s own goal corresponds to X=0 and the opposition goal to X=100.
OverlapAngle therefore does not reproduce the position of two players at a particular moment. It shows how the zones in which they performed their on-ball actions were positioned relative to each other on average.
A value close to zero means that the main action zones of the two players were at roughly the same height. The larger the angle, the more pronounced the diagonal: one player operated deeper and the other higher.
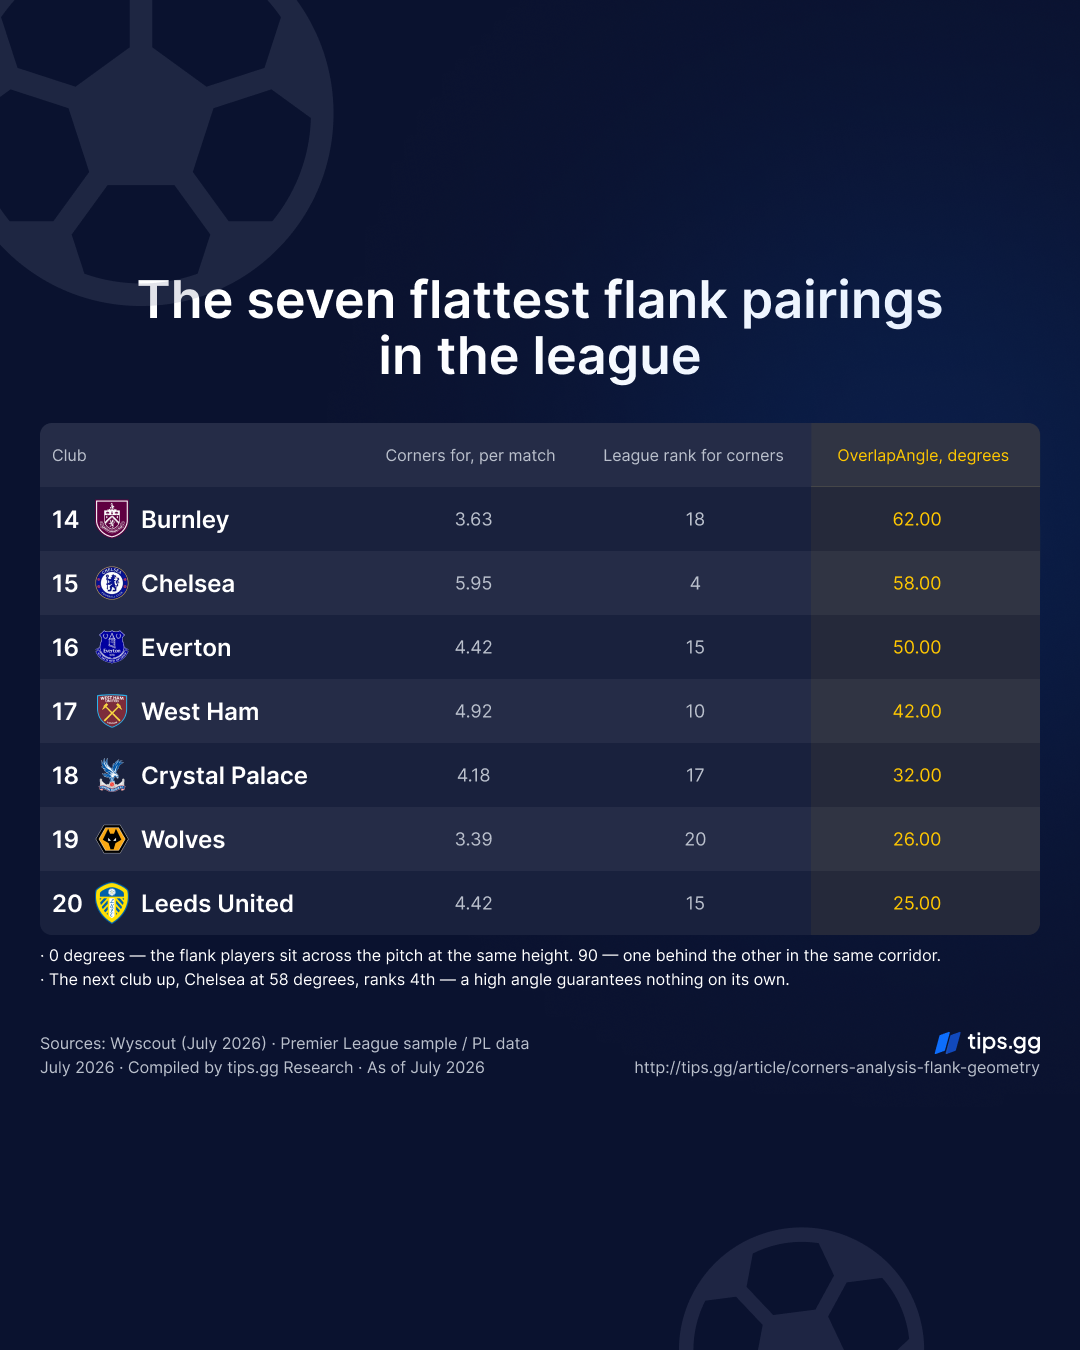
The seven lowest OverlapAngle values in the Premier League sample.
Over the closing stretch of the 2025/26 Premier League season, OverlapAngle had a correlation of 0.48 with corners won. This confirms a relationship between the internal geometry of the flank and corner numbers, although OverlapAngle becomes more informative when considered alongside the height of the pairing. Two pairings can have the same OverlapAngle while operating at completely different heights: one may already be close to the opposition byline, while the other still has a considerable distance to cover. The angle is therefore not the only variable used in the assessment.
Height and Lateral Gap
OverlapAngle shows how the two players in the pairing are positioned relative to one another, but it does not account for where that structure is located on the pitch. The same angle may belong to a pairing operating 42 metres from the opposition byline and another operating 56 metres away. Geometrically, they are organised in a similar way, but the first needs fewer actions and less time to move the ball into an area for a low cross, delivery or take-on. Time matters here: if the opponent has enough time to reorganise, the attack may end before the team reaches the byline.
For a fuller assessment of the flank structure, we therefore need two more parameters: the height of the pairing, meaning its average distance from the opposition byline, and the lateral gap between the players’ average action zones across the width of the pitch.
For the bettor, these indicators are not a formula that automatically turns coordinates into a bet, but a map of the route to the corner flag. Height shows how much ground the pairing still has to cover before reaching an area where the attack is more likely to end in a block, deflection or clearance behind. The lateral gap helps show how close the players are to each other and how easily they can support progression through short combinations.
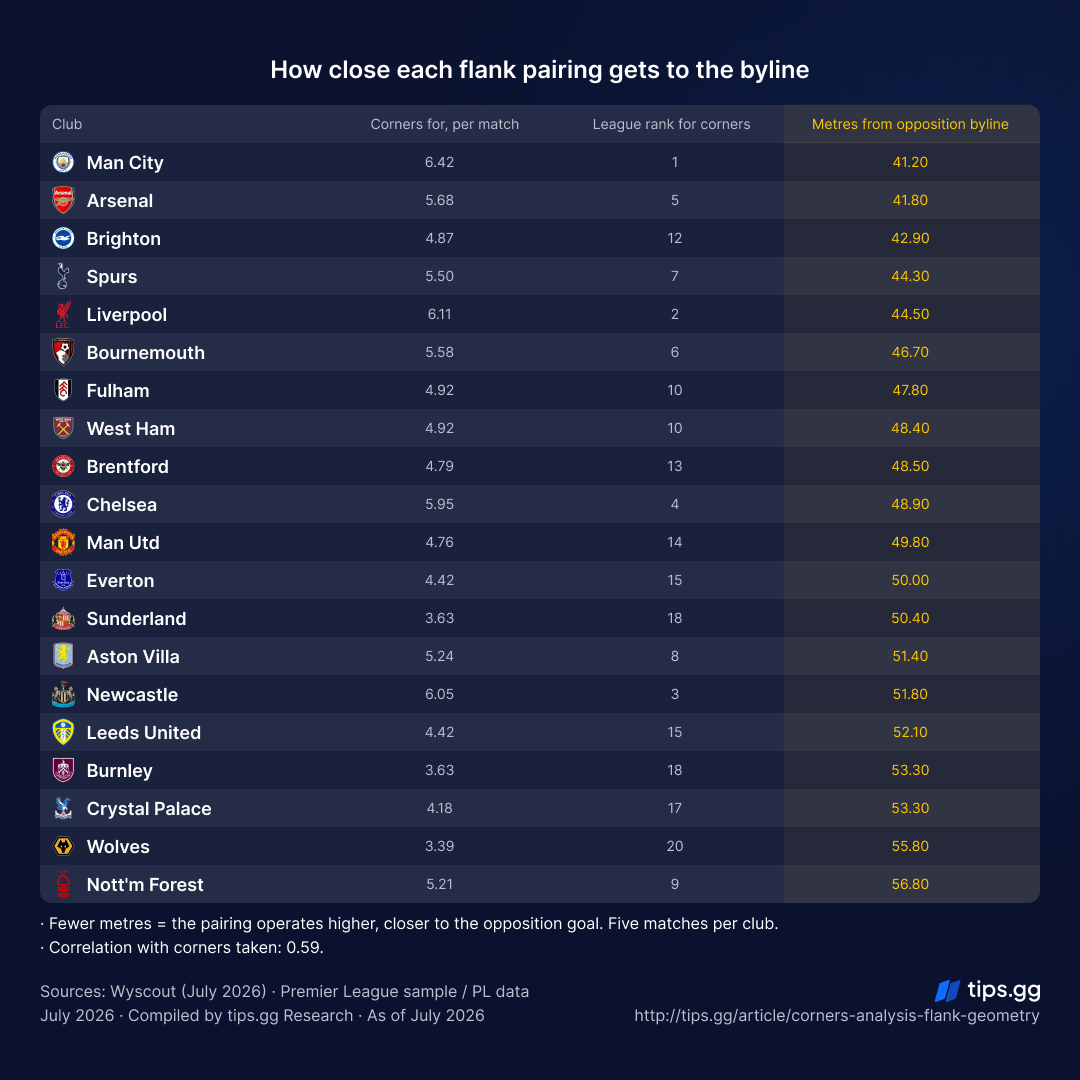
Average distance of each flank pairing from the opposition byline.
Two teams may average five corners per match while arriving at them in completely different ways. One regularly reproduces pressure near the byline; the other reaches the same figure through late attacking surges, several deflections or individual outlier matches. The statistical result is the same. For the next match, that does not have to be the case.
In betting terms, this means that the difference between a team’s average and the listed total proves nothing on its own. If a team averages five corners, a team total over 4.5 does not automatically become a value bet: the price matters, as does whether the conditions that produced those five corners are being reproduced in the current match.
In our sample, the median distance from the pairing to the opposition byline was 49.3 metres, while the median lateral gap was six metres. We used these values as boundaries that divide the teams in question in half along each axis and allow us to identify four types of flank structure.
Four Types of Flank Structure
The combination of height and lateral gap divides teams into four groups: high compact, high stretched, low compact and low stretched pairings.
In the raw data, teams with high compact pairings won the most corners, averaging 5.58 per match. High stretched pairings followed at 5.22, then low compact at 4.81 and low stretched at 4.36. The difference between the two extreme groups was 1.23 corners.
However, Manchester City, Liverpool and Arsenal all fell into the first quadrant, so part of the advantage may have been related to the teams’ overall quality. To test whether the result simply reflected the gap between stronger and weaker Premier League sides, we also controlled for points won. After that adjustment, the difference between the two extreme groups fell to 0.58 corners but remained statistically significant.
The two axes behaved differently. High pairings continued to win more corners than expected after the adjustment, while a small lateral gap showed no independent advantage. High stretched pairings even slightly outperformed high compact ones relative to expectations. The most robust finding is therefore connected specifically to height: the closer the pairing’s action zones are to the opposition byline, the fewer actions and less time are required to reach an area for a cross, low delivery or block.

OverlapAngle after the height component is removed from the comparison.
At the same time, controlling for team quality cannot completely separate geometry from a team’s other attributes. The ability to position players high up the pitch on a regular basis may itself be an expression of quality: stronger teams control territory more often, push opponents back and retain possession in the opposition half. By controlling for that factor, we inevitably remove part of the mechanism that helps those teams win corners.
Ultimately, the bettor does not need to know how many corners Manchester City would win if it stopped being Manchester City. What matters is identifying the features of the team’s real structure that help the figure repeat from match to match. The height of the pairing proved to be one such feature. The lateral gap should be treated more cautiously: it helps describe the structure of the flank and distinguish between different playing profiles, but its independent relationship with corner numbers remains ambiguous.
A quadrant defines a team’s general profile, while its predictive value depends on the team’s quality, style and the specific match scenario. Even among high compact pairings, the figure ranged from 4.87 to 6.42 corners per match. Geometry does not erase differences in quality, style or match context; it helps explain the structure through which a team reproduces its results. The most useful signal here is not the name of the quadrant, but the pairing’s ability to operate close to the opposition byline on a regular basis.
When Profiles Meet
A team’s geometry does not exist in isolation: the same method of flank play can produce different results depending on the opponent’s positioning. We therefore compared combinations of profiles in individual matches.
The most notable result came from high compact pairings facing low compact ones. In those matches, the team with the high compact pairing averaged 8.0 corners, while the combined total was 12.71. By comparison, the same type of team averaged 6.38 corners against low stretched pairings.
The average total of 12.71 characterises this specific profile combination. Its practical value in an individual match depends on how closely the same conditions are reproduced and how much of them is already reflected in the bookmaker’s line.
In this combination, the players’ areas of responsibility converge near the defending team’s byline. One pairing regularly operates high up the pitch, while the other systematically occupies deeper positions in the same flank corridor. Less space remains available, and a cross, low delivery or attempt to progress further is more likely to meet a block or a clearance behind.
The metrics do not record every direct confrontation between players, but their average positions show the areas of the pitch for which they are regularly responsible within the team’s structure. The combination of profiles can therefore serve as an additional filter when analysing a match: what matters is not only how high the attacking pairing operates, but also the structure it will encounter on the opposing side.
The flank profile, however, is shaped not only by the opponent’s structure. It also depends on the distribution of roles within the team itself: who provides width, who appears as the second player near the ball and which route the pairing uses to move towards the byline. Much of this is determined by the base formation.
How Formation Changes the Route to a Corner
A formation should not be treated as a static picture that a team preserves for all 90 minutes. Player positioning changes between possession, defence and transitional phases, but the players still retain starting areas of responsibility and recurring movement patterns. The stated formation therefore helps show who normally provides width and where support on the flank is likely to come from.
In a back four, one side is most often shared by a winger and a full-back. In our data, the full-back operated closer to the touchline in 64% of observations, while the winger was wider in roughly one-third of cases. The outside channel is not assigned permanently to a single player: the winger may move inside and free the space for the full-back’s overlap, or remain outside and receive support from deeper. Because both players are already connected to the same flank, this rotation is more likely to allow the attack to continue without a noticeable loss of tempo and bring the ball closer to the byline.
With a back four, the full-back normally already has a winger ahead of him, so the team has two natural participants on the flank. With three centre-backs, the distribution of roles is far more stable: in 88% of observations, the wing-back was the widest player and usually the only permanent participant in the outside channel. To create a second option near the touchline, another player therefore has to move out from a more central position. This role is most often performed by an interior midfielder, who generally operates deeper than a winger. In our data, wingers were positioned an average of 40.4 metres from the opposition byline, compared with 50.6 metres for interior midfielders. The same pattern appeared in all five teams that used both structures during the period examined.
To support the attack near the touchline, the interior midfielder has to change direction and move diagonally out from the centre. He spends part of the route moving laterally or half-turned towards goal, which can delay the moment when the next action becomes available. During that time, the opponent can shift across, while the attack risks losing tempo and ending in an early cross rather than progressing to the byline — the area where blocks, deflections and clearances are more likely to become corners.
This movement also changes the positioning of the players behind the immediate action. By leaving the inside channel, the interior midfielder vacates a position from which he could have contested the second ball after the cross. If his movement is not compensated for by team-mates, the team has fewer opportunities to return the ball to the flank and begin a second wave of attack that could also end in a corner.
The difference, therefore, lies not in a back four or back three as such, but in how the team organises width and a second layer of support out wide. Hybrid structures may create that second layer through a wide centre-back, a holding midfielder or other rotations. The profile of the wide player also affects the route: an inverted winger is more likely to free the outside channel for a team-mate, while a player focused on advancing down the touchline may carry the ball towards the byline himself and cross with his stronger foot.
The formation therefore serves as a clue to how the flank is organised. For corner analysis, it is more important to identify who provides width, where the second player in the pairing comes from and whether the team maintains its tempo all the way to the byline. It is through this mechanism that formation can influence corner numbers.
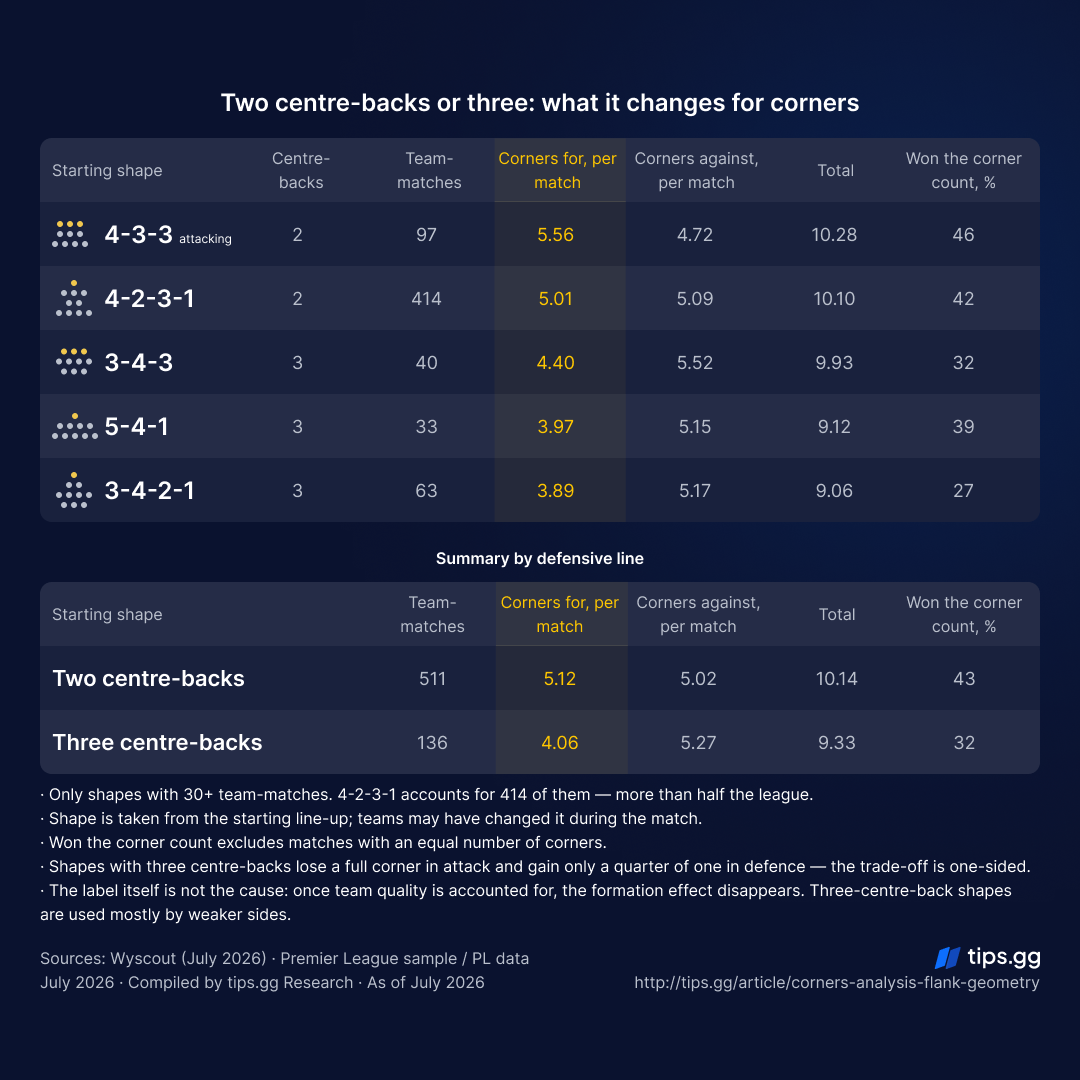
Premier League corner averages by starting formation and defensive-line structure.
One Team, Different Flank Structures
Even the profile of a single team cannot be considered permanent. It changes with the formation, the line-up and the distribution of roles. When a team moves from a back four to a back three, the familiar pairing may disappear: the full-back becomes a wing-back, the winger moves closer to the centre, and the lower level of the flank is occupied by the wide centre-back.
This was particularly visible among teams that alternated between formations. As a reminder, the higher the OverlapAngle, the more strongly one player in the pairing is positioned above the other; a value close to zero means their main action zones are at roughly the same height. Chelsea recorded an average angle of around 70° with a back four and 24° with a back three. The difference was even greater for West Ham: 64° compared with 7°. In other words, the pronounced diagonal between the two players in the pairing almost disappeared when the formation changed.
If those matches are combined into a single average, the result is a profile that the team does not actually reproduce in either formation. The number will be mathematically correct, but it will describe an artificial structure located somewhere between two clearly different ways of playing.
For forecasting, this is crucial. A team’s season average for corners may remain unchanged even though the mechanism through which those corners are created has already shifted. Replacing a winger with an interior midfielder, switching to wing-backs or losing a regularly overlapping full-back can change the height of the pairing, the distance between the players and the entire route the ball takes towards the byline.
The resulting profile therefore characterises a specific structure rather than the club independently of its line-up and formation. Before placing a bet, it is more useful to check the formation and player roles for the upcoming match than to mechanically carry over the team’s average figures from the entire season.
Even the starting structure does not guarantee that the team will preserve it throughout the match. Flank positioning changes not only after substitutions or a formation switch, but also with the match scenario. The most obvious trigger for such a change is the score.
Being Behind Does Not Mean Winning More Corners
In corner betting, it is easy to treat the score as a ready-made scenario: the team has conceded, now it has to attack, so its team corner total should rise. But the need to chase the game does not in itself create flank pressure.
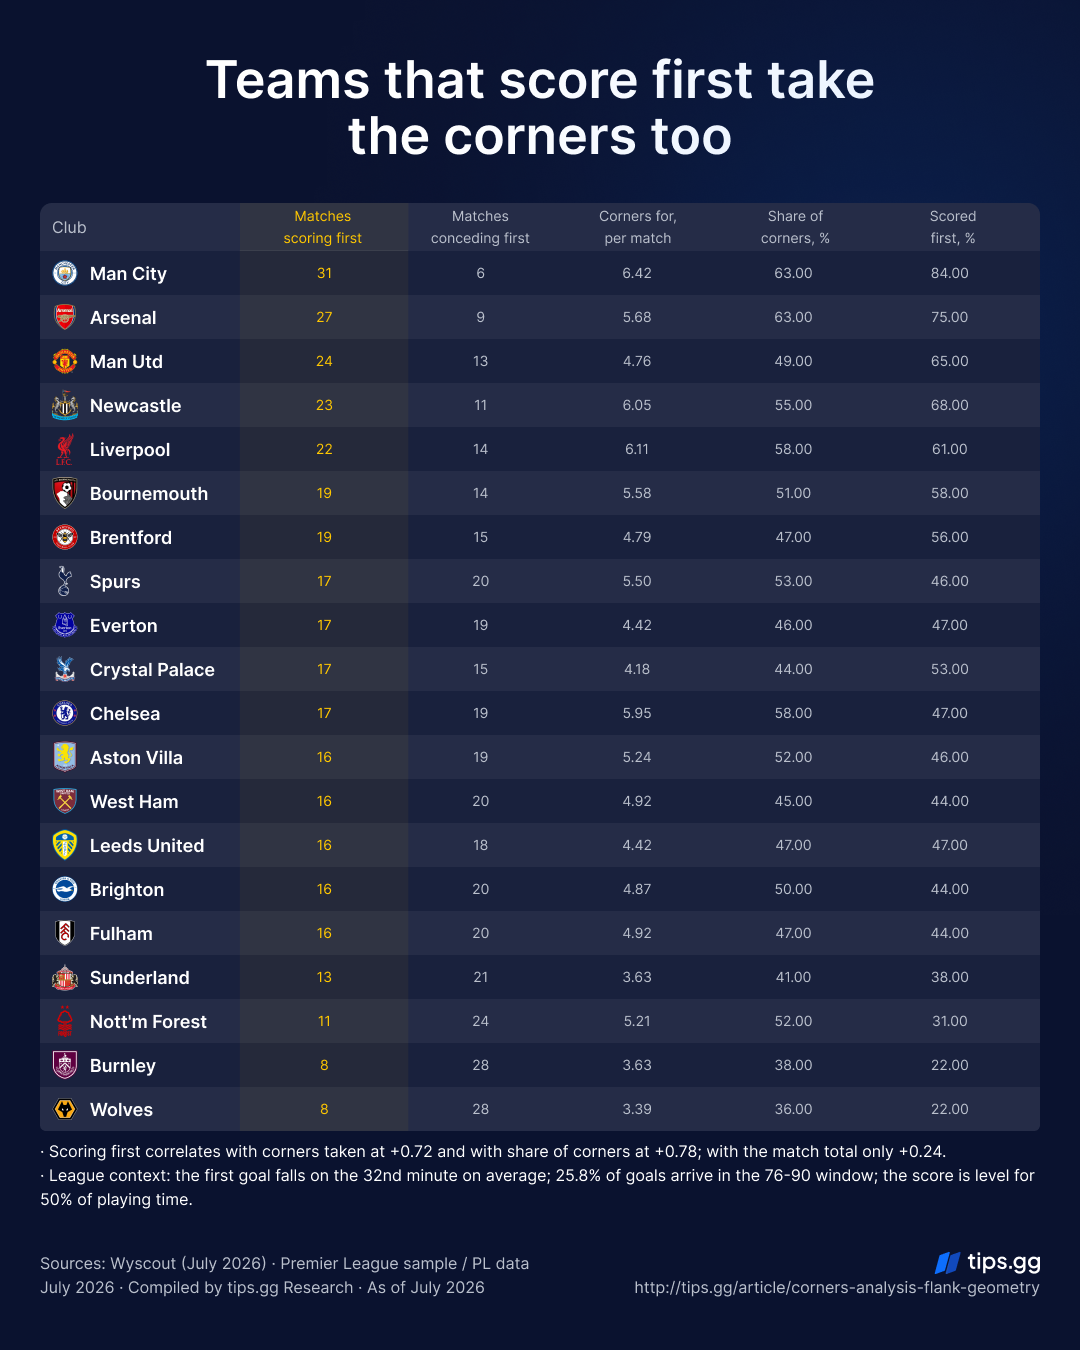
Premier League clubs that scored first more often also tended to take a larger share of corners.
After conceding, a team may indeed push its wide players higher, add a second player near the ball and progress towards the byline more frequently through overlaps, one-twos and passes in behind. In that case, the attacking mechanism itself changes, and the conditions for winning corners may grow stronger with it.
Another scenario is also possible: the team gains more possession and pins the opponent back, but continues moving the ball in front of the defensive block and finishing attacks with early crosses. Here, it is important to understand whether this is a stable method of playing or simply a handful of rushed decisions caused by the score and the diminishing time available. Repeated early crosses from different players are more likely to indicate a team pattern; isolated incidents are more likely to reflect one player’s impatience.
At the same time, activity in the final third may already prompt the live model to raise the total slightly and shorten the odds on the over. If the team has merely started releasing the ball earlier without moving its flank structure closer to the byline, the underlying corner threat may be rising more slowly than the line movement suggests.
After a change in the score, it is therefore more important to check whether the flank pairing has moved higher and whether the team has started reaching the byline regularly than to automatically follow rising possession, a higher volume of attacks and shortening odds on the over.
So Why Is It Still Worth Doing Your Own Analysis?
None of this turns corner forecasting into an exact science. Formation, the positioning of wide players, the opponent’s structure and changes in the score do not allow anyone to calculate the exact number of corners in advance. They help answer a different question: does what is happening on the pitch match the scenario that is most likely already priced into the line?
A bookmaker does not need to read every match perfectly. Its advantage comes from scale, automation, margin and book management. Even when an individual line describes a match imperfectly, the system remains profitable over the long run. The absence of deep manual analysis of a particular match does not therefore make the price incorrect in itself.
The bettor does not need to analyse football better than the bookmaker in every respect either. The task is narrower: identify an individual match in which the actual distribution of roles, the route of the flank attacks or the teams’ response to the score differs from the typical scenario. It is not enough simply to notice pressure, a formation change or high possession. The important question is whether those developments alter the ball’s route towards the byline — towards the area where blocks, deflections and clearances behind are more likely to produce corners.
Doing your own analysis makes sense not as a search for a bookmaker’s mistake or as a way to predict the exact number of corners. It is a test of how well the price reflects the specific mechanism of the match. The bookmaker may not understand that mechanism better than the bettor and still win over the long run. But precisely because its estimate is designed for the long run, individual matches still leave the bettor room to reach an independent conclusion.