
| Prefer us on Google — see Tips.gg in Top Stories & Discover | Add on Google |
The first thing a viewer can judge about a footballer, whether from the stands or on television, is his physique. Height, build, shoulder width, leg length and overall power are visible almost immediately, and they already give some idea of how a player may be able to use his body on the pitch. Physical profile is also an important part of how players are evaluated in modern football.
What is much harder to see is how much demanding running that player can produce over the course of a match. A player may be quick, strong or explosive, but those qualities alone do not tell us how often he can use his speed, how much distance he covers at higher speeds, or how consistently he can repeat that work over 90 minutes.
How fast a player can run matters. But there is a difference between being able to reach a high speed and being able to do it repeatedly throughout a match. The latter tells us more about intensity: not just the player’s physical ceiling, but how regularly he can use his speed as part of his overall workload.
That creates a fairly simple problem. Total distance does not tell us how quickly those kilometres were covered, while a maximum-speed figure does not tell us how often a player ran at anything close to it. So if we want to compare how intense different players’ workloads actually are, we first need a way to measure both parts together.
How we measure intensity
That distinction also explains why top speed is a useful starting point. It does not measure intensity by itself, but it shows the upper limit of what a player can physically produce. Extra pace can help a player reach the ball first, recover after being caught out of position or cover space for a teammate. The question is how often he can turn that capacity into actual work over the course of a match.
For that reason, we started with the fastest players in each position group in the 2025/26 Champions League. We selected the 20 players with the highest recorded top speeds in each of five broad positional groups, then removed players whose tournament playing time was too limited to support a reliable per-90 comparison.
For each of the remaining players, we then looked at how his total running distance was distributed across five speed zones. This gives us more than a single distance figure: it shows how much of that workload was accumulated at low, moderate and high speeds.
The source data divides each player’s distance into five ranges: 0–7 km/h, 7–15 km/h, 15–20 km/h, 20–25 km/h and 25+ km/h. To make those profiles comparable, the first step is to convert each zone share into actual kilometres.
For each zone, the calculation is straightforward:
Zone distance = total distance × zone share
We then assign a progressively higher weight to each speed range. The faster the running, the more it contributes to the final score:
| Speed zone | Weight |
|---|---|
| 0–7 km/h | ×1.0 |
| 7–15 km/h | ×1.5 |
| 15–20 km/h | ×2.0 |
| 20–25 km/h | ×2.5 |
| 25+ km/h | ×3.0 |
The weights increase in equal 0.5 steps. This keeps the contribution of each speed zone proportional: faster running is valued more highly, while the lower-speed parts of a player’s workload still remain part of the calculation.
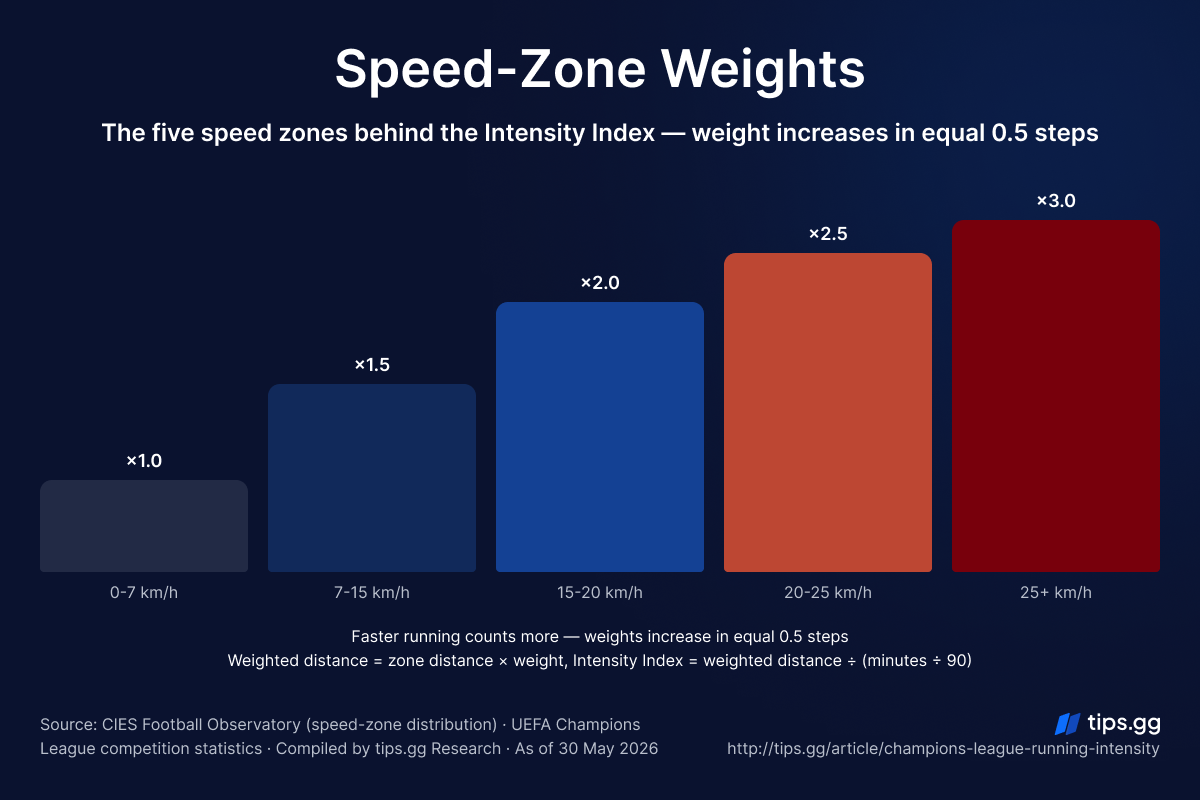
Download all assets for free here
First, we calculate the weighted distance:
Weighted distance = sum of each zone’s distance × its weight
Then we adjust it for playing time:
Intensity Index = weighted distance ÷ (minutes played ÷ 90)
This gives every player a single per-90 figure that reflects both how much ground he covers and how much of that work comes at higher speeds.
The sample
The starting sample contains 100 players: the 20 fastest by recorded top speed in each of five broad position groups.
To reduce the effect of small samples on the per-90 figures, players with fewer than 450 tournament minutes were excluded. That leaves 72 players in the final ranking.
For each of them, the analysis combines playing time, total distance and the distribution of that distance across the five speed zones described above.
The most intense players in the sample
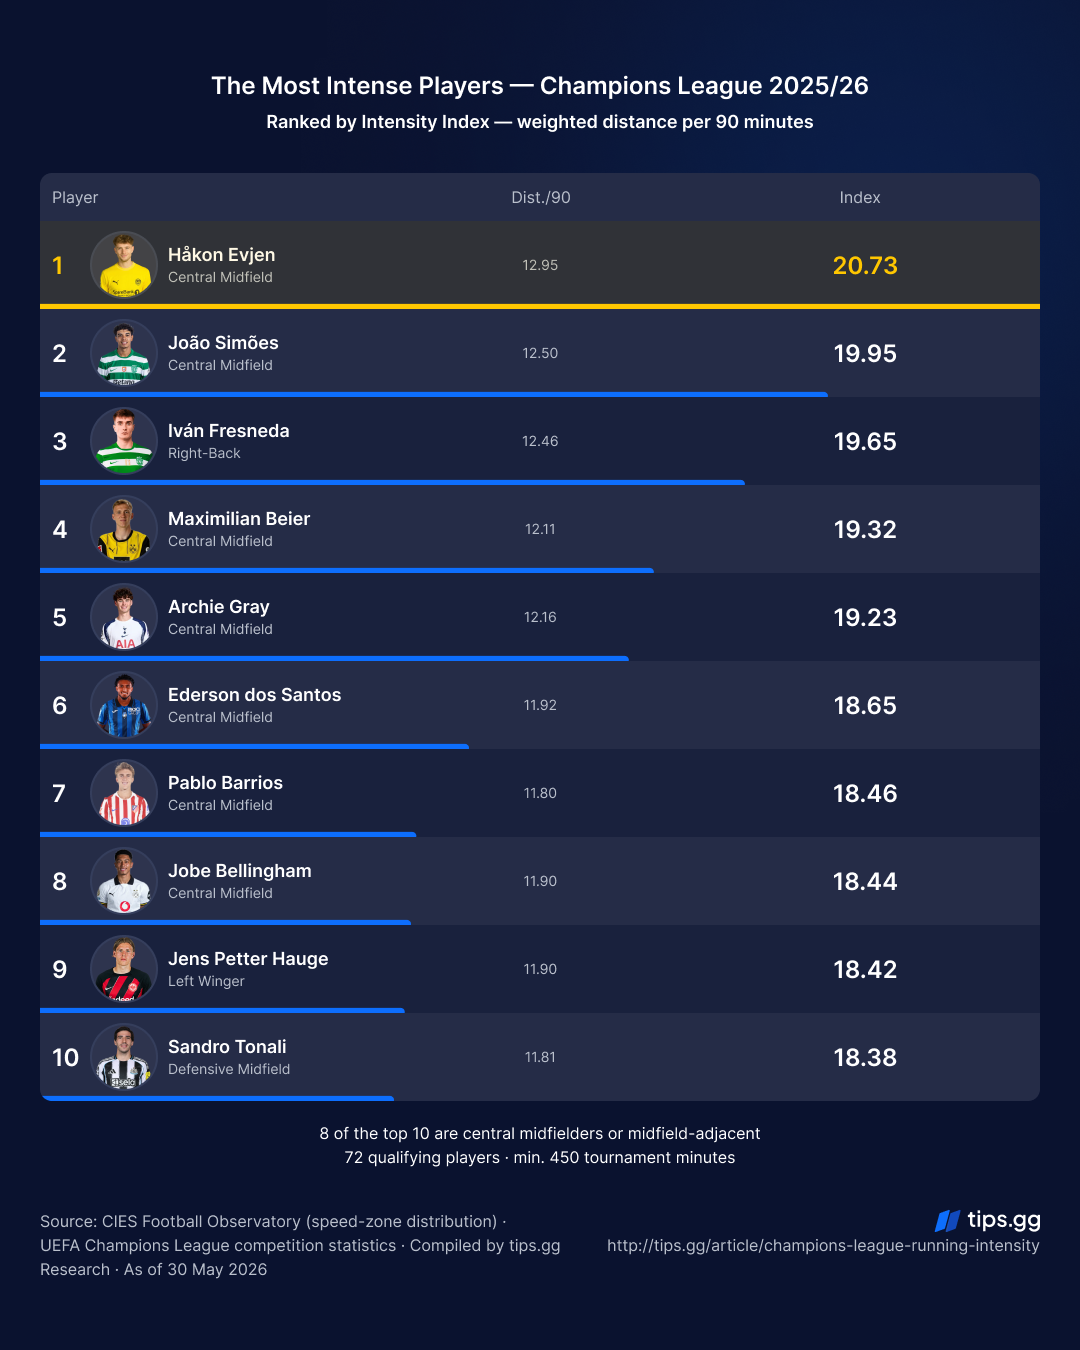
Applying the calculation to the 72 qualifying players gives the following overall top 10:
Download all assets for free here
Håkon Evjen leads the ranking with an Index of 20.73. He also has the highest distance per 90 in the qualifying sample at 12.95 km, which makes him a useful example for showing how the calculation works in practice.
How Håkon Evjen’s 20.73 is calculated
Evjen covered 148.2 km in 1,030 minutes. His total distance breaks down across the five speed zones as follows:
| Speed zone | Distance | Weight | Weighted distance |
|---|---|---|---|
| 0–7 km/h | 34.09 km | ×1.0 | 34.09 |
| 7–15 km/h | 68.47 km | ×1.5 | 102.71 |
| 15–20 km/h | 30.38 km | ×2.0 | 60.76 |
| 20–25 km/h | 12.15 km | ×2.5 | 30.38 |
| 25+ km/h | 3.11 km | ×3.0 | 9.34 |
The weighted distance is 237.27.
Evjen played 1,030 minutes. To convert the weighted total to a per-90 rate, we divide it by 1,030 ÷ 90 = 11.44.
237.27 ÷ 11.44 = 20.73
That gives Evjen an Intensity Index of 20.73, the highest figure in the qualifying sample. The same calculation is applied to every player in the ranking.
A same-position comparison
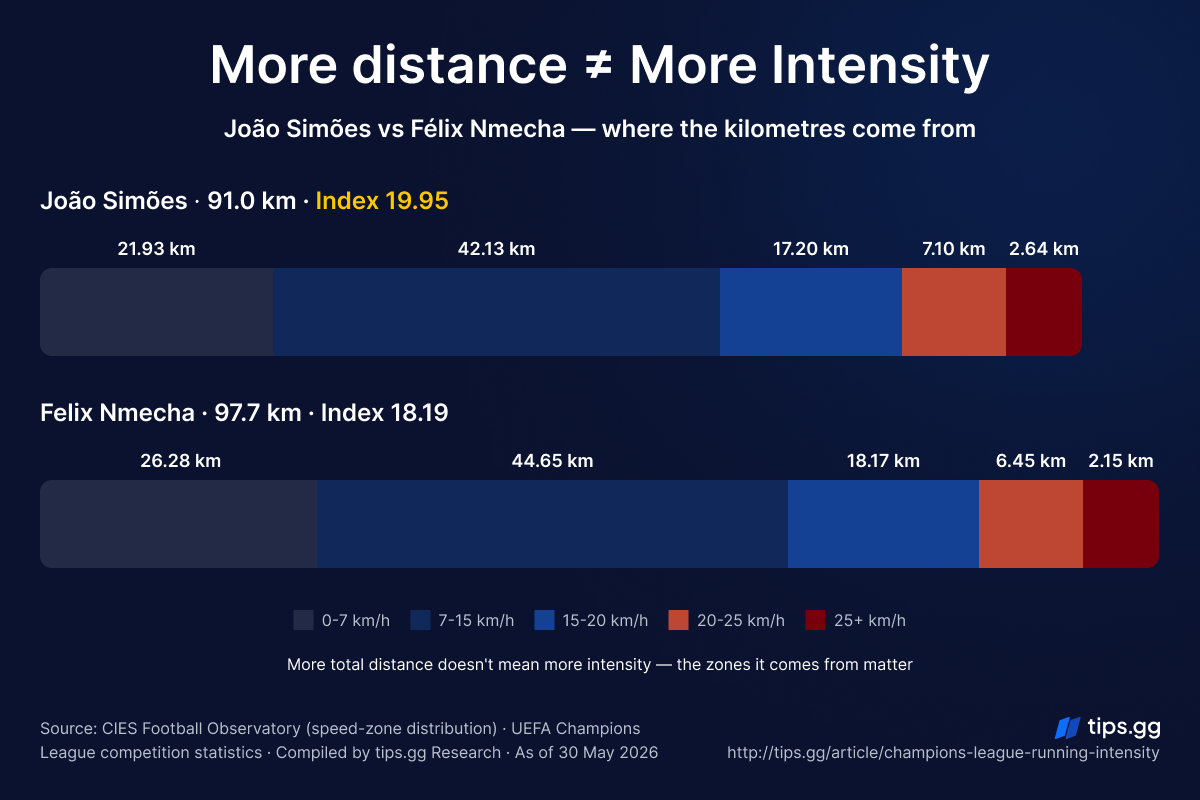
João Simões and Felix Nmecha are both classified as central midfielders. Nmecha covered more total distance over the tournament: 97.7 km compared with 91.0 km for Simões.
The difference becomes clearer when that distance is split across all five speed zones:
| Speed zone | João Simões | Felix Nmecha |
|---|---|---|
| 0–7 km/h | 21.93 km | 26.28 km |
| 7–15 km/h | 42.13 km | 44.65 km |
| 15–20 km/h | 17.20 km | 18.17 km |
| 20–25 km/h | 7.10 km | 6.45 km |
| 25+ km/h | 2.64 km | 2.15 km |
Nmecha accumulated more distance in each of the three lower speed zones. Simões covered more ground in both zones above 20 km/h: 9.74 km in total, compared with 8.60 km for Nmecha.
After applying the five-zone weighting and converting the result to a per-90 rate, Simões records an Intensity Index of 19.95, while Nmecha scores 18.19.
Download all assets for free here
The most intense players by position
Centre-forwards
| POS | Player | Dist./90 | Index | Overall rank |
|---|---|---|---|---|
| 1 | Hugo Ekitike | 11.33 | 17.52 | 17 |
| 2 | Nicolò Tresoldi | 11.30 | 17.33 | 21 |
| 3 | Alexander Sörloth | 11.23 | 17.04 | 26 |
| 4 | Christian Kofane | 11.01 | 16.95 | 28 |
| 5 | Viktor Gyökeres | 11.07 | 16.84 | 30 |
Hugo Ekitike combines the highest Intensity Index among centre-forwards with the most distance covered per 90 in the group. Viktor Gyökeres offers a different profile, ranking second for 25+ km/h distance per 90 while also accumulating more total distance across the tournament than any other qualifying centre-forward. The top five remain tightly grouped, with less than one Index point separating first from fifth.
Wingers
| POS | Player | Position | Dist./90 | Index | Overall rank |
|---|---|---|---|---|---|
| 1 | Jens Petter Hauge | Left Winger | 11.90 | 18.42 | 9 |
| 2 | Giuliano Simeone | Right Winger | 11.56 | 17.88 | 14 |
| 3 | Michael Olise | Right Winger | 11.39 | 17.60 | 16 |
| 4 | Wilson Odobert | Left Winger | 11.16 | 17.49 | 18 |
| 5 | Anthony Elanga | Right Winger | 10.88 | 17.06 | 25 |
Jens Petter Hauge records the highest distance per 90 among qualifying wingers despite ranking 14th of 15 for the share of distance above 20 km/h and last for 25+ km/h distance per 90. Anthony Elanga, meanwhile, posts the highest 20+ and 25+ km/h distance per 90 in the group, giving him the strongest high-speed profile among the top five.
Central midfielders
| POS | Player | Dist./90 | Index | Overall rank |
|---|---|---|---|---|
| 1 | Håkon Evjen | 12.95 | 20.73 | 1 |
| 2 | João Simões | 12.50 | 19.95 | 2 |
| 3 | Maximilian Beier | 12.11 | 19.32 | 4 |
| 4 | Archie Gray | 12.16 | 19.23 | 5 |
| 5 | Ederson dos Santos | 11.92 | 18.65 | 6 |
Four of the five highest-ranked central midfielders also sit inside the overall top five. Håkon Evjen tops the entire qualifying sample with 12.95 km per 90 and an Intensity Index of 20.73, while Maximilian Beier stands out for a different reason: he records the highest 20+ and 25+ km/h distance per 90 in the midfield group. João Simões sits between them in the positional ranking with an Index of 19.95.
Defensive midfielders are included in the same positional group, although they appear lower down the ranking. Sandro Tonali is the highest-ranked defensive midfielder in 8th within the combined midfield group, followed by Vitinha in 11th and Marten de Roon in 12th. Beier, who usually operated as an inside player underneath the striker alongside Karim Adeyemi, predominantly from the left half-space, is also included with the central midfielders for this analysis.
Full-backs / wing-backs
| POS | Player | Position | Dist./90 | Index | Overall rank |
|---|---|---|---|---|---|
| 1 | Iván Fresneda | Right-Back | 12.46 | 19.65 | 3 |
| 2 | Achraf Hakimi | Right-Back | 11.04 | 17.40 | 19 |
| 3 | Nahuel Molina | Right-Back | 11.37 | 17.40 | 20 |
| 4 | Nico O’Reilly | Left-Back | 11.24 | 17.30 | 22 |
| 5 | Raoul Bellanova | Right Wing-Back | 11.02 | 17.14 | 23 |
Iván Fresneda is the most striking positional outlier in the ranking. Despite recording the lowest top speed among the 13 qualifying full-backs and wing-backs at 33.1 km/h, he ranks first for Intensity Index, distance per 90 and 20+ km/h distance per 90. His 2.25-point advantage over second place is also the largest first-to-second gap across the five position groups, while Achraf Hakimi records the highest 25+ km/h distance per 90.
Centre-backs
| POS | Player | Dist./90 | Index | Overall rank |
|---|---|---|---|---|
| 1 | Eric García | 10.75 | 16.29 | 34 |
| 2 | Nico Schlotterbeck | 10.46 | 15.59 | 47 |
| 3 | Manuel Akanji | 10.26 | 15.56 | 48 |
| 4 | Jarell Quansah | 10.36 | 15.52 | 49 |
| 5 | Lloyd Kelly | 10.30 | 15.43 | 51 |
High-speed output among centre-backs is strongly influenced by tactical context, particularly the height of the defensive line and how often defenders have to make recovery runs towards their own goal. Several players in the sample, including Abdukodir Khusanov, accumulated minutes across more than one defensive position. In Khusanov’s case, his time at right-back is relevant to a profile that includes the highest top speed among qualifying centre-backs at 36.1 km/h and the second-most distance above 20 km/h per 90, as full-backs generally perform more high-speed work. Eric García, meanwhile, tops the Intensity Index through the highest overall distance per 90 in the position.
How intensity differs by position
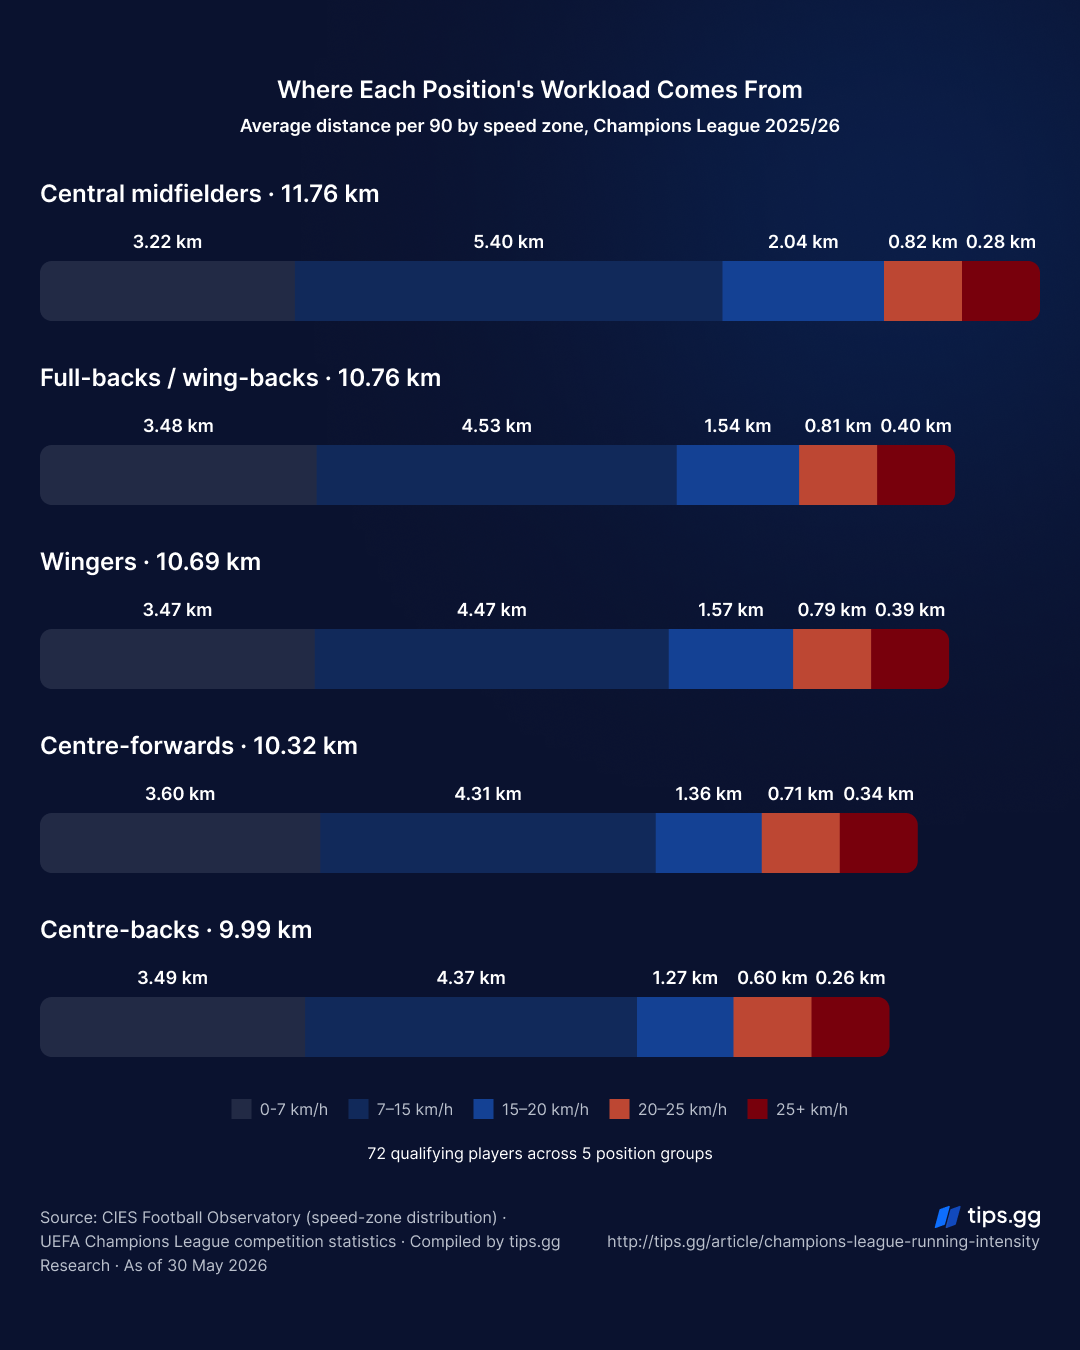
The positional rankings also reflect different physical demands. Central midfielders cover the most ground per 90 in this sample, while wingers and full-backs / wing-backs spend a larger share of their distance above 20 km/h.
| Position | Avg. Dist./90 | Avg. Index | Avg. share at 20+ km/h |
|---|---|---|---|
| Central midfielders | 11.76 km | 18.28 | 9.3% |
| Full-backs / wing-backs | 10.76 km | 16.57 | 11.2% |
| Wingers | 10.69 km | 16.47 | 11.1% |
| Centre-forwards | 10.33 km | 15.61 | 10.2% |
| Centre-backs | 9.99 km | 14.86 | 8.6% |
Centre-backs have the lowest average Index in the sample because the position places lower demands on this type of running intensity.
Download all assets for free here
Does intensity skew younger?
Across all 72 qualifying players, the average age is 25.2 as of 30 May 2026. The overall top 10 in the Intensity Index are notably younger, averaging 22.9 — a difference of 2.3 years.
| Position | Top-5 avg. age | Position avg. age |
|---|---|---|
| Central midfielders | 22.8 | 24.8 |
| Centre-forwards | 24.0 | 26.0 |
| Wingers | 23.6 | 24.5 |
| Full-backs / wing-backs | 24.6 | 25.2 |
| Centre-backs | 26.2 | 25.5 |
The age difference is most pronounced among central midfielders and centre-forwards, whose top five are around two years younger than their positional groups. It is smaller among wingers and full-backs / wing-backs, while centre-backs are the only group where the top five are older than the positional average.
What the data suggests
The main separator at the top of the ranking is not exceptional sprinting on its own. The highest scores come from players who combine a large overall workload with enough running in the faster zones to keep that workload demanding throughout the match.
That also explains why central midfielders are so prominent near the top. Their advantage comes less from producing the most extreme high-speed numbers and more from sustaining the largest volume of work across the full speed range. Wingers and full-backs reach similar intensity in a different way, with less total distance but a greater concentration of it at higher speeds.
The broader point is that intensity is better understood as a profile than as a single physical trait. Maximum speed shows what a player is capable of; the distribution of his running shows how much of that capacity he actually uses over 90 minutes.
Sources: CIES Football Observatory (speed-zone distribution); UEFA Champions League competition statistics (minutes, distance and top speed). All performance data cover the same competition period. Figures may vary depending on provider methodology; all derived metrics are author calculations. Player dates of birth were used for the age calculation as of 30 May 2026.