| Prefer us on Google — see Tips.gg in Top Stories & Discover | Add on Google |
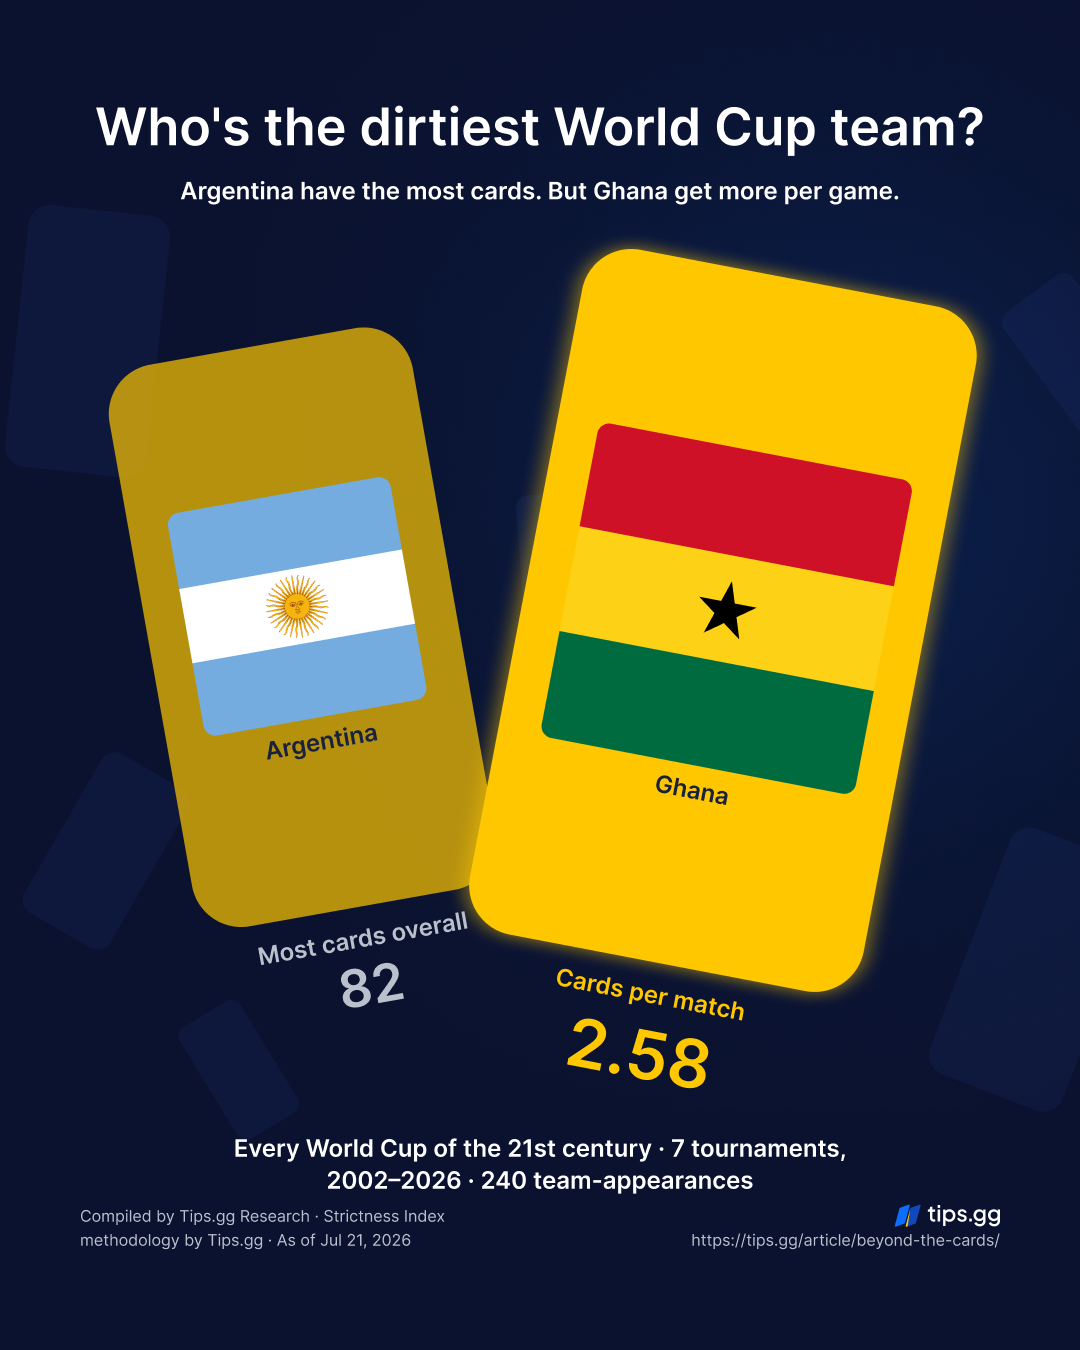
Argentina have collected more cards at the 21st-century World Cup than anyone else – 82 disciplinary points across seven tournaments. But here’s the catch. Per match, they don’t even crack the top ten. The team that actually plays dirtiest, game for game, is one almost no one would name in a hundred guesses, and it has never once made it past the quarter-finals.
Download all assets for free here
That gap between “most cards” and “dirtiest” runs through everything that follows. We looked at all seven World Cups of the century, from Korea/Japan 2002 to the 48-team edition of 2026, and ran every team through a single measure – the TipsGG Strictness Index – to find out who the referees really reach for their pockets against.
A quick word on how we’re counting
Not all cards are equal, so we don’t treat them that way. A yellow is worth 1 point. A second yellow – the kind that gets a player sent off – is worth 2. A straight red, the worst of the lot, is worth 3. Add a team’s cards up and you get its Strictness Summary, the SS. That’s the raw total.
The problem with raw totals is that they reward survival. A team that reaches the final plays seven or eight matches; a team knocked out in the group stage plays three, and naturally collects fewer cards simply because it spends less time on the pitch. So we divide each team’s SS by its matches played to get the Strictness Index – cards per game. That’s the number that matters, and as you’ll see, it rearranges the whole table. (All of this is TipsGG research, using the same method for every team and tournament.)
The total rankings – and why they mislead
Here is the obvious place to start: who has racked up the most over twenty-plus years.
| Rank | Team | Yellow | 2nd Yellow | Direct Red | Total SS | Matches | SI |
|---|---|---|---|---|---|---|---|
|
1 |
Argentina |
74 |
1 |
2 |
82 |
39 |
2.10 |
|
2 |
Portugal |
56 |
3 |
3 |
71 |
31 |
2.29 |
|
3 |
Brazil |
60 |
1 |
2 |
68 |
39 |
1.74 |
|
4 |
Netherlands |
59 |
4 |
0 |
67 |
27 |
2.48 |
|
5 |
France |
55 |
0 |
3 |
64 |
40 |
1.60 |
|
6 |
Mexico |
55 |
1 |
2 |
63 |
28 |
2.25 |
|
7 |
Germany |
54 |
3 |
0 |
60 |
38 |
1.58 |
|
8 |
South Korea |
55 |
0 |
0 |
55 |
27 |
2.04 |
|
9 |
Uruguay |
43 |
1 |
3 |
54 |
25 |
2.16 |
|
9 |
Switzerland |
46 |
1 |
2 |
54 |
25 |
2.16 |
Argentina sit on top with 82. But look one column to the right: 39 matches, tied with Brazil for the most on the list. They lead the count in large part because they keep reaching the business end of tournaments and keep playing more football. The more games you play, the more cards you accumulate – it’s almost that simple.
Then there’s the genuinely strange thing about Argentina. Seventy-four yellows, two straight reds, and across the first six tournaments of the century not a single player booked twice in the same game and sent off – zero second yellows, an extraordinary streak. It finally broke in 2026, when they picked up their first second yellow in twenty-four years of World Cup football. One, in seven tournaments. Most teams near the top have several; the Netherlands have four. Argentina have built a mountain of cautions while almost never crossing the specific line that turns two yellows into an early shower. It’s a weirdly disciplined kind of indiscipline – they foul constantly, but they rarely lose the plot.
The Dutch are the opposite temperament. Four second yellows is the most of any team, the signature of players going one challenge too far. Portugal have the spikiest top end of all: three second yellows and three straight reds, the only nation in real danger on both fronts.
And then, third on the list, Brazil. The country synonymous with joga bonito, with flair and samba and football as joy – third dirtiest of the century by raw count, with 68 points. Hold that thought, because the per-match table is about to do something interesting to it.
The real ranking: cards per match
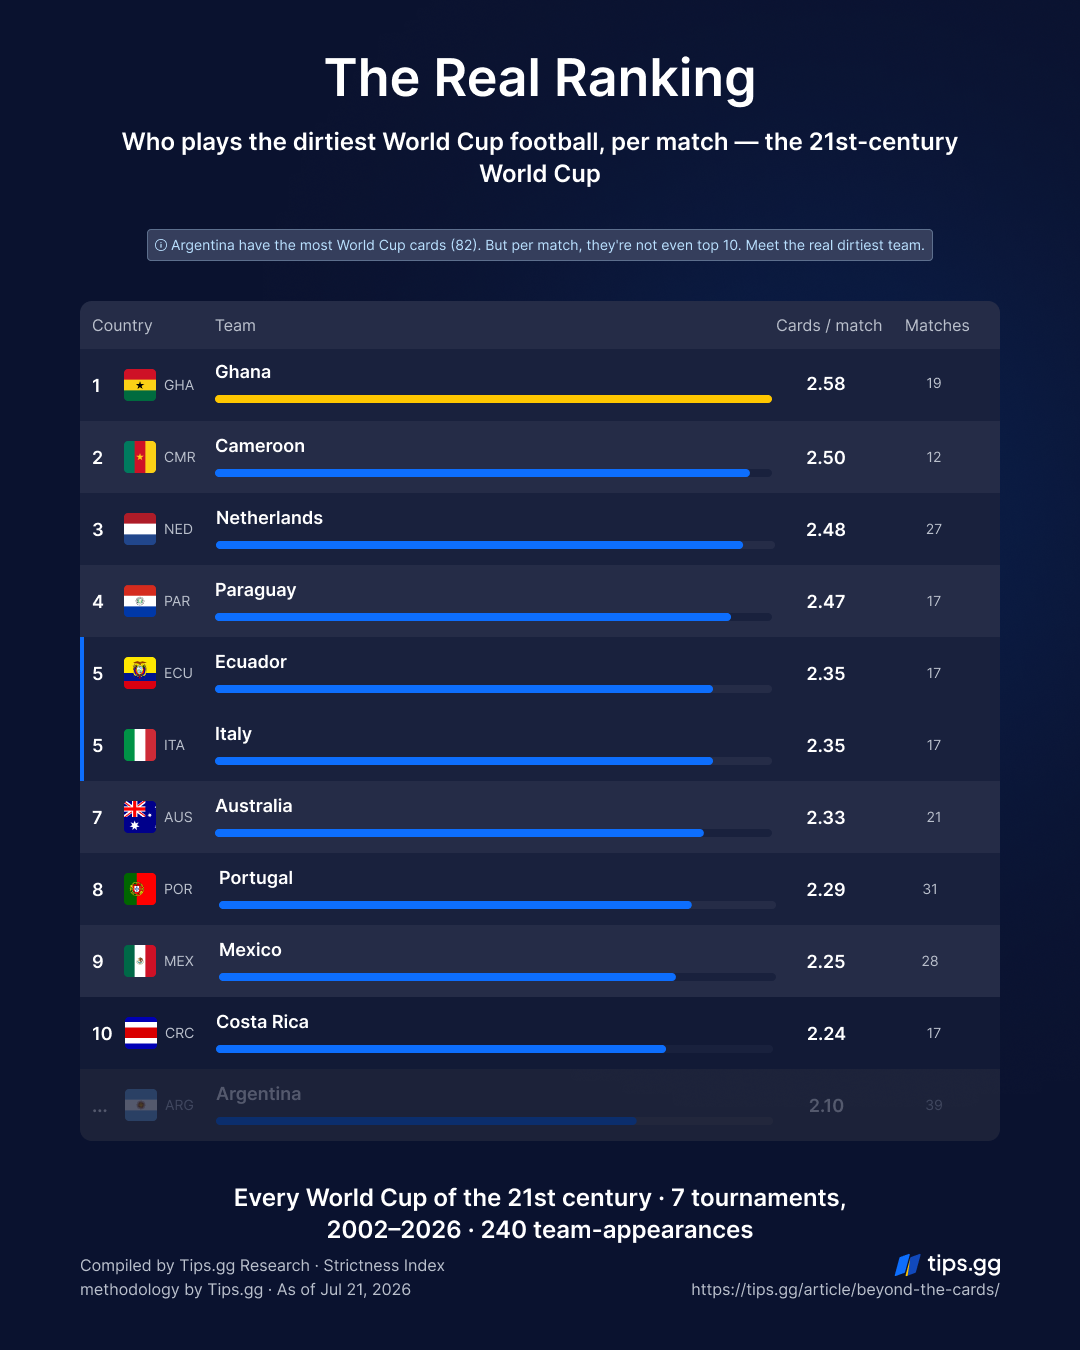
This is the table the raw count was hiding. Strip out the advantage of longevity, divide by games played, and a completely different cast of teams rises to the top. (To keep the comparison fair, this table is limited to nations with at least a dozen World Cup matches this century – enough of a sample to mean something.)
| Rank | Team | Strictness Summary | Matches | SI (cards/match) |
|---|---|---|---|---|
|
1 |
Ghana |
49 |
19 |
2.58 |
|
2 |
Cameroon |
30 |
12 |
2.50 |
|
3 |
Netherlands |
67 |
27 |
2.48 |
|
4 |
Paraguay |
42 |
17 |
2.47 |
|
5 |
Ecuador |
40 |
17 |
2.35 |
|
5 |
Italy |
40 |
17 |
2.35 |
|
7 |
Australia |
49 |
21 |
2.33 |
|
8 |
Portugal |
71 |
31 |
2.29 |
|
9 |
Mexico |
63 |
28 |
2.25 |
|
10 |
Costa Rica |
38 |
17 |
2.24 |
Top of the pile: Ghana, at 2.58 cards a game. Not Argentina, not Italy, not some grizzled European side – Ghana, a team whose best-ever run ended in the quarter-finals and never went further, and yet the most carded nation of the century by rate. They simply pack their fouling into a handful of matches and then go home. No one expects Ghana at number one. That is rather the point.
Now find Argentina. They aren’t here. Top of the raw table with 82 points, they fall to roughly 14th by rate, at 2.10 – well outside this top ten. Their lead, it turns out, was an illusion of longevity, not a record of aggression.
Look at the company Ghana keep, too. The per-match table is dominated by African and mid-tier nations – Cameroon, Paraguay, Ecuador, Australia – alongside the Netherlands and a frozen-in-time Italy, who haven’t qualified since 2014 and whose rate is essentially a fossil from a rougher refereeing era. These are teams that play hard in fewer games rather than the usual heavyweights coasting through seven or eight. There’s a logic to it: a side that arrives as the underdog, often defending a lead or chasing a game it expects to lose, fouls more per ninety minutes than a favourite controlling possession. The big nations spread their cards thin across long runs. Everyone else concentrates theirs into a short, frantic stay. “Most cards” and “dirtiest” are two different questions, and they have two different answers. The first rewards the teams that win; the second exposes the teams that scrap.
Download all assets for free here
Where the cards came from: tournament by tournament
Each World Cup has its own weather. Some are storms, some are oddly calm.
| Year | Yellow | 2nd Yellow | Direct Red | SS | SI |
|---|---|---|---|---|---|
|
2002 |
261 |
6 |
11 |
306 |
4.78 |
|
2006 |
307 |
20 |
9 |
374 |
5.84 |
|
2010 |
244 |
8 |
9 |
287 |
4.48 |
|
2014 |
180 |
3 |
7 |
207 |
3.23 |
|
2018 |
221 |
2 |
2 |
231 |
3.61 |
|
2022 |
221 |
3 |
1 |
230 |
3.59 |
|
2026 |
266 |
2 |
13 |
309 |
2.97 |
Korea/Japan 2002 set the early tone, with Turkey the most carded side (SS 25 across seven matches) and Nigeria the cleanest of all, on a barely-there SS 2.
Then came 2006, the peak – and the spike wasn’t random. Before a ball was kicked in Germany, FIFA’s referees committee ordered officials into a “Zero Tolerance” enforcement of reckless tackles, shirt-pulling, time-wasting, and elbows in aerial duels. Crucially, this was a directive, not a rule change: the same laws, applied with the brakes off. The result was an SI of 5.84 and twenty second yellows in a single tournament – ten times the figure recorded in 2018 or 2026. Portugal were the dirtiest team of that summer at SS 26, the single highest team-tournament score anywhere in the data. Saudi Arabia were the calmest, on 5.
South Africa 2010 belonged to the Netherlands (SS 24), and a remarkable chunk of it arrived in one match – the final, where the Dutch alone collected nine yellows. More on that shortly.
Brazil 2014 was, until recently, the quietest tournament of the lot, an SI of 3.23. That fall tracked the slow softening of the laws after the Zero Tolerance years receded. The hosts topped their own tournament’s table at SS 14, which is unusual – home teams usually get the benefit of the doubt, not extra cautions. Spain were cleanest at SS 3.
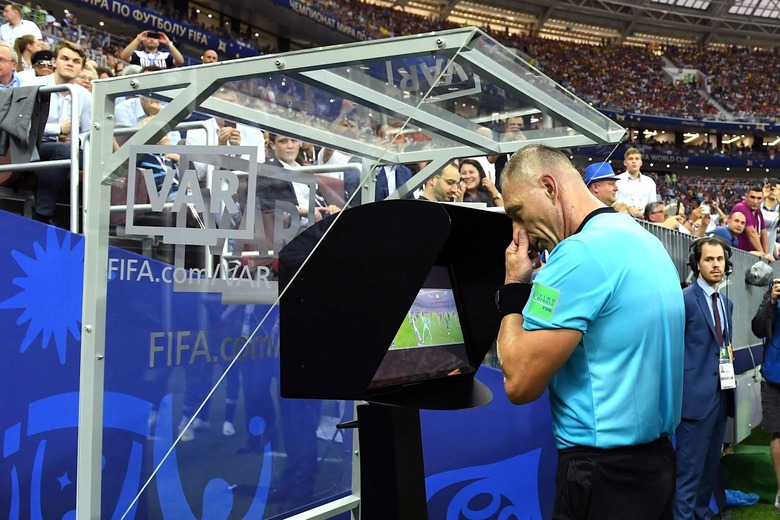
Russia 2018 introduced VAR and, with it, a new normal: an SI down to 3.61, with Croatia the most carded (SS 15) and Saudi Arabia astonishingly disciplined on SS 1. Qatar 2022 all but matched it at 3.59, with Argentina dirtiest (SS 17, much of it crammed into one notorious night) and England cleanest on a single point. Watch Saudi Arabia across the years for whiplash: SS 5 in 2006, down to 1 in 2018, then up to 14 in just three matches in 2022.
And then 2026 – 48 teams, 104 matches, and the calmest World Cup of the century by rate: an SI of just 2.97, below even 2014. Doubling the field didn’t make the football dirtier per game; it diluted it, flooding the schedule with lopsided group matches that drag the average down. Argentina were the most-carded side again (SS 15, a finalist’s tax), while Czechia and Tunisia tied as cleanest on a single point. The one place 2026 bucked the calm was straight reds – thirteen of them, more than any tournament this century. Hold that thought too.
Source: engadget.com
The Dirtiest Team of Every Tournament – Once You Count Per Match
Switch from raw totals to cards per match and something odd happens: the dirtiest team of almost every World Cup this century turns out to be a side that never escaped the group stage. Three combative games, an early flight home, and a per-match rate no deep-running giant can touch.
| Tournament | Dirtiest team (per match) | SS | Matches | SI |
|
2002 |
Slovenia |
13 |
3 |
4.33 |
|
2006 |
Serbia and Montenegro |
15 |
3 |
5.00 |
|
2010 |
Australia |
13 |
3 |
4.33 |
|
2014 |
Uruguay |
11 |
4 |
2.75 |
|
2018 |
Panama |
11 |
3 |
3.67 |
|
2022 |
Saudi Arabia |
14 |
3 |
4.67 |
|
2026 |
Qatar |
10 |
3 |
3.33 |
The peak of the whole exercise is Serbia and Montenegro in 2006: 15 points in three games, an SI of 5.00 – the highest per-match figure any tournament leader has posted. Knocked out in the group, they still out-fouled everyone who stayed. Portugal topped that summer’s raw table at SS 26, but across seven matches that comes to only 3.71.
Saudi Arabia 2022 is the neatest illustration of the trick, and the most ironic. The same Saudi side flagged above as historically mild collected 14 cards in three matches for an SI of 4.67 – the dirtiest rate of the tournament by a distance. Argentina won the raw count that year with 17, but they played seven games to get there; spread out, that’s just 2.43 per match. The team that went furthest looked far calmer than the team that went home first.
2018 gives the purest underdog story. Panama, in their only ever World Cup appearance, were the dirtiest team per game at 3.67 – while Croatia, who collected the most cards overall and reached the final, sat at a mild 2.14 per match. Reaching the final is precisely what dilutes the number. 2002 rhymes with it: Slovenia led at 4.33 despite a group exit, while raw-total leader Turkey played seven matches on the way to third place and finished at 3.57.
2026 keeps the pattern intact even in a calm year. The per-match crown went to Qatar – out after three games, one of the new faces in the expanded 48-team field – at 3.33 a game, while finalists Argentina looked mild at 1.88. And note how much lower that leading figure sits: 3.33 would not have topped a single pre-2026 tournament except 2014. The most combative team of 2026 would have been mid-table in most other years.
The pattern, per TipsGG research, is consistent: deep runs dilute a team’s average, because more games mean more low-card matches dragging the rate down. Short, spiky campaigns do the opposite. Foul your way to an early exit and you top this table; win your way to a final and you look respectable per game.
The matches that defined a team’s record
Two games tower over everything else, and between them they explain a surprising slice of the all-time table.
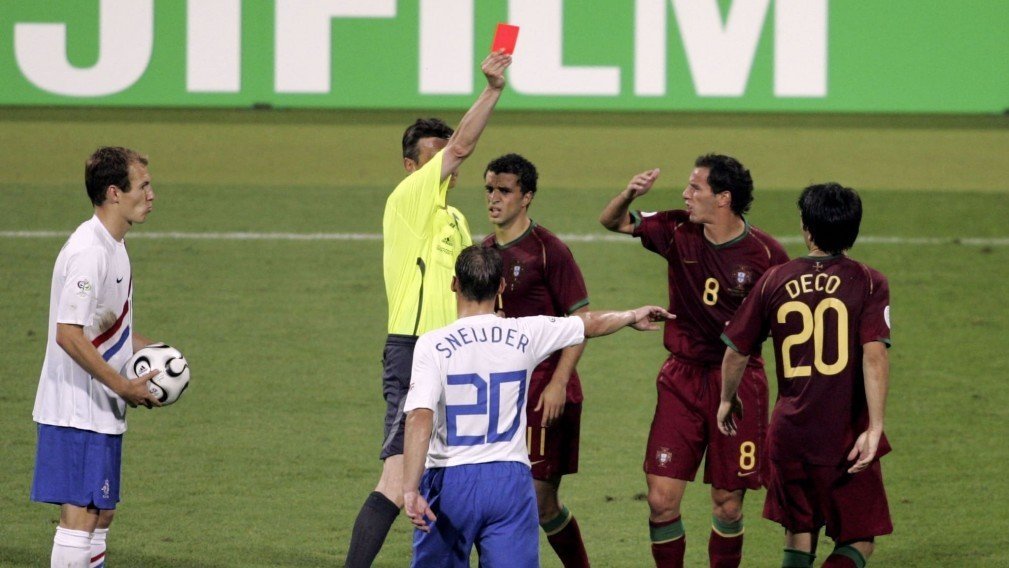
The first is Portugal’s 1–0 win over the Netherlands in the round of 16 in 2006 – the Battle of Nuremberg. Referee Valentin Ivanov ran out of patience and then ran out of cards: 16 yellows and 4 reds, 20 in total, still the most carded match in World Cup history per official FIFA records. Portugal took the lion’s share, enough to drive them to that tournament-leading SS of 26. It remains the high-water mark for a single team in a single World Cup.
The second came sixteen years later: Argentina 2–2 Netherlands in the 2022 quarter-final, the Battle of Lusail. Eighteen yellows and a red – the most yellow cards ever shown in a World Cup match, again per official FIFA records, every one of them brandished by referee Mateu Lahoz. Argentina alone accounted for ten of those bookings, a single-team record, the flashpoint coming when Leandro Paredes thumped a clearance straight into the Dutch bench. That one match is the biggest single reason Argentina sit atop the raw rankings at all.
2026, for all its thirteen red cards, produced nothing to rival either. Its discipline problems were spread thin – across more teams and more games, not concentrated into one referee’s nightmare. The two great card-storms of the century still bookend the eras: Nuremberg holds the record for total cards and reds in the wild pre-VAR years; Lusail holds the record for yellows in the cooler, video-reviewed age that followed.
The VAR effect – and the Argentina exception
VAR arrived at Russia 2018, and the structural break is hard to miss. Average pre-VAR Strictness Index (2002–2014): 4.59. Post-VAR (2018–2026): 3.32 – a drop of nearly 28%. Second yellows collapsed and stayed low: 6, 20, 8, 3, then 2, 3, 2. But yellows barely moved on a per-match basis. The tactical foul survived the cameras; the full meltdown did not.
There is, though, one striking exception to the calming trend – direct reds. They fell off a cliff after VAR (11, 9, 9, 7, then 2, then 1), only to come roaring back in 2026: thirteen straight reds, the most of any tournament this century. Some of that is arithmetic – 104 matches instead of 64 – but not all of it; even per game, reds ticked up. The likelier culprit is 2026’s fresh batch of directives, including mandatory dismissals for leaving the field in protest and a harder line on dissent. The “reds are all but extinct” story of 2018–2022 did not survive the expanded format.
What’s just as telling is what VAR did to individual teams. Line up each major side’s cards-per-match rate before the cameras arrived (2002–2014) against after (2018–2026), and almost everyone tidied up:
- Portugal: 3.00 → 1.43. More than halved – the steepest reform of any heavyweight, and a long way from the side that gave the world the Battle of Nuremberg.
- Croatia: 2.89 → 1.50. A team that reached the 2018 final and somehow came out calmer under the new scrutiny, not edgier.
- Netherlands: 2.89 → 1.67. Down sharply, though they remain the most card-prone of the group across the full span.
- Brazil: 1.96 → 1.40. The joga bonito reputation finally matching the numbers.
The pattern is uniform: more scrutiny, fewer cards. And then there is Argentina, walking the other way. Their index rose after VAR, from 1.95 to 2.55, then settled at 2.26 across the full post-VAR span – the only major nation that got worse while everyone else got cleaner. Part of that is Lusail, part of it is the 2022 run as a whole, and it was Argentina, of all teams, who finally logged a second yellow in 2026 – the one heavyweight still leaning in while the rest leaned out. (A small footnote that tells its own story: one of Argentina’s 2022 bookings went to a member of the coaching staff, possible only because of the 2019 rule extending cards to team officials – fitting, for the one team determined not to mellow.)
Source: soccer24.co.zw
2026: the verdict is in
This time the mould was already broken – and now the numbers are in. Forty-eight teams, 104 matches, and, exactly as expected, the fattest raw totals of the century: 266 yellows, comfortably more than any tournament before it. Argentina duly topped the raw team count once more (SS 15), the finalist’s tax showing up right on schedule.
The real question was always the rate – and here 2026 delivered a genuine surprise. Post-VAR, the Strictness Index had held at 3.59–3.61 for two tournaments running. Nearly doubling the field didn’t push it up; it pulled it down, to 2.97 – the calmest World Cup of the century, and the first ever to dip below three. All that extra football turned out to be mostly extra low-card football: mismatched group games that added yellows to the pile while lowering the average.
Two findings stand out. First, the red-card reversal: after cratering to 2 and then 1, direct reds jumped to 13, a century high, most likely the bite of 2026’s new anti-protest and dissent directives. Second, the per-match crown went, as ever, to a group-stage casualty – Qatar, home after three games, at 3.33 – while the deep runners looked tame. The two questions this whole piece is built on still give two different answers.
And the structural wrinkle finally moved. The sides that used to cram their fouling into three games and fly home – the Ghanas, Cameroons, and Paraguays that rule the per-match table – now get more matches to play, more low-card games to dilute their own rate. It shows: Ghana still top the all-time per-match table, but at 2.58 now, down from the 2.87 they carried before 2026 (six cards across four games this time). The longevity advantage that put Argentina on top is, at last, something the smaller nations are starting to share – and the gap between “dirtiest by rate” and “most cards overall” is beginning to close.
A note on the method – and its limits
The Strictness Index is deliberately simple: it counts cards and divides by games. That simplicity is the point, but it isn’t the whole story, and it’s worth being upfront about what the number doesn’t capture. It treats a 90-minute group game and a 120-minute knockout as equal, when extra time offers extra chances to be booked. It doesn’t adjust for the referee, whose personal threshold can swing a match’s card count on its own (Mateu Lahoz’s three games in 2022 ran to an SI of 9.00, per TipsGG data – well above any team’s rate). Nor does it account for the opponent: cards are often reciprocal, one team’s aggression drawing a response in kind. And cards are only one visible trace of “dirty” play – fouls that go unbooked never enter the ledger. Read the Index for what it is: a consistent, like-for-like measure of who referees actually punish, not a complete verdict on who fouls the most. A fuller model – minutes played, referee tendencies, opponent effects, raw foul counts – is the natural next step, and one we intend to build.